Is it good news or bad news that the rate of unemployment in the United States has gone back to a 50-year low of 3.5%? It depends on what caused it. Discussing this question will lead us to look at numbers that some may find surprising.
Figure 1 and Figure 2 show the evolution of the unemployment rate and of total (non-farm) employment under the previous and current administration. There appears to be little difference. If we calculate the average (compounded) quarterly growth of employment between, on the one hand, the first quarter of 2009 and the first quarter of 2017 (the Obama administration) and, on the other hand, the first quarter of 2017 and the third quarter of 2019 (the Trump administration thus far), we get a quite small difference with respectively 0.3% and 0.4%.
Figure 1: Unemployment Rate

Figure 2: Employment Level

A few caveats: Small compounded differences will matter as time passes, if they persist. We are comparing only nine quarters of Trump administration against eight years of Obama, and broad macroeconomic series are not necessarily significant in the short run. Moreover, note that a decrease in the unemployment rate from, say, 4.5% to 3.5% should be more difficult to obtain than a reduction from 5.5% to 4.5%. This is not only because the percentage of the decrease is higher in the first case, but also because increasing employment becomes more difficult as full-employment is approached.
The first hypothesis for the apparently (slightly) better performance under Trump is that it has been caused by the removal of obstacles to employment, such as previously higher taxes and regulation growth. Such a result would of course be good: everybody wants to work at the prevailing wage rate can find a job and increase his consumption.
If however—this is the alternative hypothesis—the reduction of unemployment has been driven by an increase in the number of individuals who are necessary to produce the same or lower GDP per capita, then the news would be bad. For example, if all mechanization were forbidden in agriculture, at least 15 million new jobs would be created—about three times more than the current number of unemployed. More radically, if computers were forbidden, imagine the increase in employment! North Korea must always be at full employment, but with a low GDP per capita, which is bad.
As a matter of fact, under both Trump and Obama, real GDP per capita increased, and the rate of growth under Trump (a compounded quarterly average growth rate of 0.5%) has been higher than under Obama (0.4%). The difference is small and is not obvious on Figure 3, which shows quarter-by-quarter increases in real GDP per capita.
Figure 3: Quarterly Growth of Real GDP per Capita
Now suppose that imports are banned or restricted by government-imposed handicaps such as higher tariffs. Then, more employment will be needed to produce the same volume of, say, furniture and sporting goods that were previously imported from China—and were effectively purchased with exports of agricultural products and jetliners employing fewer workers. Comparative advantage implies that fewer workers (or fewer hours per worker) were needed than with less free trade. Theoretically, in other words, less free trade implies more employment but less consumption. This suggests that, instead of GDP per capita, we look at consumption expenditures per capita.
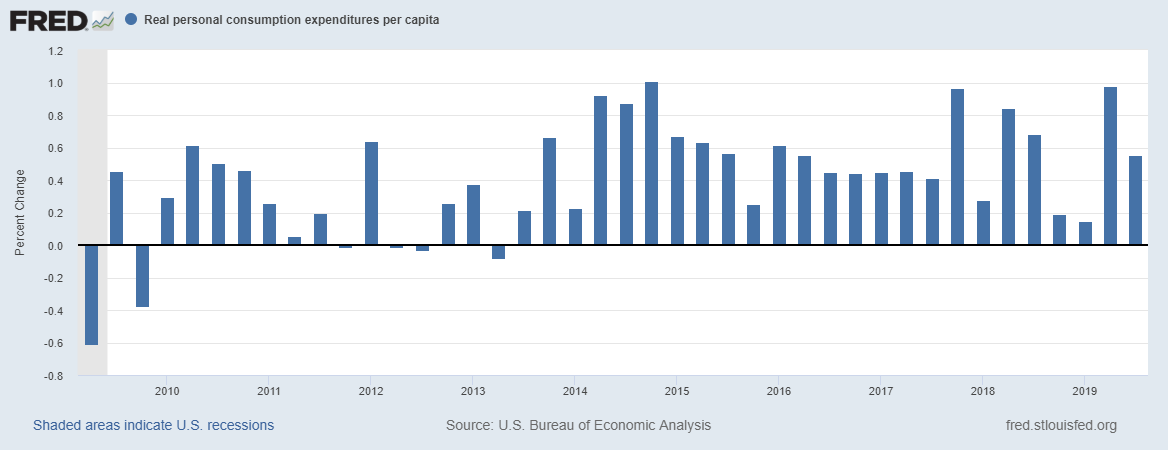
Figure 4 and 5 show real personal consumption expenditures per capita in both levels and quarter-to-quarter percentage change. Here again, there is no obvious difference in the pattern of change between the previous and current administrations, except perhaps for the return of high volatility under Trump. We can however calculate that real consumption expenditures per capita grew at a (compounded) quarterly rate slightly higher under the Trump administration (0.6%) than under the Obama administration (0.4%).
Figure 4: Real Personal Consumption per Capita

Figure 5: Quarterly Growth of Real Consumption Expenditures per Capita

These data suggest that the net effect of Trump’s policies has been to extend the previous trends in employment and economic growth. And they do not show that the increases in employment have been obtained at the cost of lower GDP or consumption per capita.
Why didn’t Trump’s trade wars have more of a negative effect? First, it is nearly certain that economic growth would have been higher without them; the fact that it did not decrease does not mean that it has not been affected. Second, despite the drop in imports and exports caused by Trump’s trade wars, trade–and especially trade with China–remain a small part of the American economy, of which two-thirds is made of (mostly) non-traded goods and services such as housing, health care, and education. Data analysis from Galina Hale and Bart Hobijn of the San Francisco Fed shows that total imports from China correspond to about 1.9% of American personal consumption expenditures.
The answer to our starting question, then, is that the recent increase in employment and lower unemployment are quite certainly good news. Certain Trump policies such as the reduction of tax rates and lower growth of regulation have more than compensated for his disastrous trade policies (and increased public debt). How long will the good policies make up for the bad ones is a question that time will answer.
P.S. (12/14/2019): See Jon Murphy’s valid critique and my rejoinder in the comments below.
READER COMMENTS
Loquitur Veritatem
Dec 12 2019 at 1:08pm
Taking as a starting point January 2000, when the labor-force participation rate hit its post-WWII peak, and adjusting for the decline in the rate since then, the “real” unemployment rate as of November 2019 is 9.4% vs. 4.0% in January 2000. At the depth of the Great Recession the nominal rate was 9.9% and the “real” rate was 14.4%. Progress since then is largely illusory. Details here: https://politicsandprosperity.com/economic-growth-since-world-war-ii/#employment
Jon Murphy
Dec 12 2019 at 2:28pm
It’s not really accurate to adjust for the decline in the LFPR and call that the “real” unemployment rate. The LFPR may fall for any number of reasons, only few of which could reasonably be called “unemployment.” For example, when I left my old job to become a full-time grad student, the LFPR fell. But it would be erroneous to call me “unemployed.” Indeed, much of the LFPR decline could be described this way. Other examples include: people taking early retirement, stay-at-home parents, folks in the military, and folks on disability. None of these are really unemployed, per se.
Now, there is an unemployment rate that tracks those who want to work but are not actively searching (and thus out of the LFPR) on top of those who are actively searching: that’s the U-6 unemployment rate, which is currently around 6.9%.
That’s not supported by the numbers you show. Citing two points does not a trendline make, especially given the cyclical nature of unemployment. What we should be looking at is the overall trend.
Thaomas
Dec 12 2019 at 7:40pm
I don’t find your analysis particularly persuasive. If regulatory changes and the reduction in the dead-weight loss of business taxation by reducing the highers marginal business tax rate are good for the economy, they are small positive supply shocks that would show up only in the long run just as the increase in the federal deficit and more restrictions on imports will reduce growth in the long run. One should not expect such changes to have visible macroeconomic effects over the course of one or two presidential administrations.
Jon Murphy
Dec 12 2019 at 8:14pm
Why? I mean, the long run is made up of many short runs, so why wouldn’t one expect to start to see effects in the short run?
Warren Platts
Dec 13 2019 at 4:53pm
It is not at all clear that Trump’s tariffs have slowed down economic growth. In the 30+ years of the free trade era, economic growth has averaged ~2.5% compared to around 3.5% growth in the previous 30 year period. If free trade was such a panacea, we should have seen growth accelerate rather than slow down.
Yes, yes. I know. There were a lot of other things going on at the time. Like computers and robotics! And Clean Air Acts and Clean Water Acts and Endangered Species Acts. But still, according to standard economic theory, tariffs should, other things being equal, reshore U.S. domestic and thus increase employment. Sorry, but I don’t buy the idea that trade deficits don’t matter. Trade deficits represent an export of U.S. demand and an import of surplus nations’ unemployment.
But still, granted, there is Ricardo’s theory of national comparative advantage itself. Free trade and national specialization should tend to reduce global deadweight losses, and, other things being equal, should increase global economic growth, including in North America. Therefore, measures such as tariffs that reduce international trade will at the least cause economic growth to be somewhat slower than it otherwise would be.
But–and this is something that is never talked about–increasing national division of labor necessarily reduces intra-national division of labor. Consider Ricardo’s original example: both England and Portugal make both cloth and wine. But in England why is it that some workers grow wine, while others weave cloth, and vice versa in Portugal? Presumably, in England, it is because wine growing is the personal comparative advantage of some workers, and in Portugal, weaving happens to be the personal comparative advantage of some Portuguese workers. Thus, by forcing all English wine growers into the weaving industry, and forcing all Portuguese weavers into wine growing, you are forcing people into lines of work into which they are not particularly suited. Efficiency losses must result!
Free trade has absolutely decimated some industries, such as furniture-making. It is not as if–unlike buggy whips–the demand for furniture has died out. We just import it all now. So there were a lot of workers who were very skilled furniture-makers. That was their personal comparative advantage. Thus by forcing them into another line of work, whether it be working on the Boeing assembly line (highly unlikely anyway) or (much more likely) working as a cashier at Dollar Store, that person’s skills are not being used to their utmost maximum. Efficiency losses are the result.
Thus to the extent that Trump’s tariffs can reshore a few manufacturing jobs, that will increase USA’s division of labor, that should in turn result in efficiency gains as people whose personal comparative advantage is making things with their hands find more opportunity. Efficiency gains should be expected. Then through the Baumol effect, this in turn should result in higher wages for other low-income workers as well. And that is exactly what we are seeing: wages for the lowest workers are increasing faster than any other income segment (except maybe for top 0.1%ers who never seeem to lose out).
Bottom line: Trump’s tariffs seem to be working as predicted.
PS If real personal consumption expenditures per capita under Trump are growing at 0.6% per year compared to 0.4% under Obama, I wouldn’t call that “slightly higher”. That is a big deal: real consumption is growing 50% faster under Trump!
Pierre Lemieux
Dec 14 2019 at 12:57pm
With due respect, @Warren Platts, you don’t seem to understand comparative advantage, which, as Krugman argued, is a complicated theory. The simplest possible example: decreasing your own interindividual division of labor would translate into increasing your own (intra) division of labor–in the sense that you would make more of the goods and services you now buy. This would not mean that your comparative advantages are “being used to their utmost maximum.” On the contrary, you would have to work as much for less consumption, or much more for the same consumption.
Warren Platts
Dec 16 2019 at 11:47pm
Interesting. It is true that I consider myself something of a generalist, jack-of-all-trades, and no doubt as a result, I am certainly less wealthy–at least in materially–than many of my old college buddies who turned themselves into one-trick ponies specializing in fields like oncology or patent law or professors in various esoteric fields of knowledge. However, your analogy breaks down at the national level. I am not saying that people should not specialize. What I am saying is that national specialization reduces the opportunities for personal specialization. Before “free” trade, in Ricardo’s example, an Englishman had two possible choices to specialize in; afterwards, there is only one choice. Efficiency losses must result.
An ecosystem is much like a national economy. It can be specialized or it can be diversified. One can have a pristine rain forest, or one can have a specialized palm oil plantation. In the former case, it is not pure autarchy–there are still allochthonous inputs mainly in the form of stuff that drifts downstream in rivers and movements of migratory animals–but it is not like the palm oil plantation that sends palm oil to one quarter of the world, imports fertilizer another quarter of the world, and tended by machines manufactured in yet another quarter of the world. But in terms of converting sunlight into biochemical mass and energy, the pristine rainforest is the more efficient. It is the same with big national economies.
If you want to stump a free trader economist, ask him or her what exactly a big, continental-sized economy like the USA’s ought to specialize in.
Don Boudreaux
Dec 17 2019 at 3:39pm
Warren Platts writes: “If you want to stump a free trader economist, ask him or her what exactly a big, continental-sized economy like the USA’s ought to specialize in.”
I’ve a question for Mr. Platts: What makes you think that the case for free trade in any way depends upon the ability of anyone – whether free trader, Trumpian protectionist, or Bolshevik comrade – to know in the abstract “what exactly a big, continental-sized economy like the USA’s ought to specialize in” – or, for that matter, what even the smallest and most singular economic entity ought to specialize in?
At the core of the case for free trade is the recognition that no one can tell absent open competition what should be the production specialities of particular economic entities. If it were possible in the abstract, and independently of actual competitive processes, to know the details of patterns of specialization then one of the core reasons for a policy of free trade would be absent.
It is not, then, the free trader who is “stumped” by an inability to know in the abstract what the pattern of specialization should be; the one stumped by this inability is the protectionist. The reason is that the protectionist – unlike the free trader – professes an ability to divine independently of actual competitive processes, what should be the pattern of specialization.
Warren Platts
Dec 17 2019 at 6:14pm
Dr. Boudreaux, as a Trumpian protectionist, the answer to your or my question is that the USA should not attempt to specialize in anything and rather attempt to diversify our economy as much as possible. Just judging from our main exports, it appears that soybeans and other raw materials are what the supposed largest economy on the Planet is specializing in. And so for the sake raw materials exporters, we have (just judging by job numbers) roughly given up half the manufacturing capacity we otherwise would have.
It wasn’t worth it. There were millions of people whose personal absolute advantage was showing up on time and making things with their hands, be it furniture, textiles, leather, computers or whatever. And since those jobs have been eliminated, it makes our economy less diverse, and these former factory workers have been forced into the service sector where they only have a comparative advantage, and their productivity is reduced as a result.
Thus, it is no surprise to me, at least, that USA’s growth rates in the free trade era–and especially since the post-2001 PNTR era–has been slower on average than in the bad old days when the barbarians were in charge and there were recessions every 5 years.
But if I were to put my mercantilist hat on, my advice is that the USA, to the extent it specializes at all, it should be whatever the USA’s absolute advantage is. And that is not agriculture and mining. Yes, we are great at soybeans; but so is Brazil. Yes, we are good at cattle; but so is Argentina. Yes, we are good at oil, but so is Saudi Arabia. Even aircraft, Airbus and other foreign producers do pretty good, and now that the bean counters have prevailed over the engineers at Boeing, that company is circling the drain.
Thus if there is one thing that USA has an absolute advantage in, I would say it is inventing new things. But the problem with inventions is they are basically just ideas, and ideas leak across borders faster than water through a sieve unless heroic measures are taken to prevent that. And of course you free traders are not prepared to take such measures, thus condemning USA to “managed decline” at best.
But, anyways, that is the reason we have Trump, and that is also the reason he will get re-elected, and after he finishes his 2nd term, he will be replaced by someone with a similar, true-conservative mindset.
Jon Murphy
Dec 17 2019 at 8:16pm
Point of fact, the US does have absolute advantage in agriculture and mining. According to the World Bank, the US is either at the top or near the top for agricultural output per worker and mining output per worker.
Warren Platts
Dec 18 2019 at 12:54pm
Not sure what your point is here. According to the classic model, agriculture and mining are what 3rd world countries are supposed to specialise in and trade for manufactured goods from the developed world. You would have us regress. And at any rate, the entire Ag & Mining sectors combined only add up to 2.4% of total U.S. GDP. If USA wants to remain the top economy in the world, that is not going to happen on the backs of Ag & Mining.
Jon Murphy
Dec 18 2019 at 2:24pm
My point is twofold:
1) Your claim that the US does not have absolute advantage in agriculture and mining is factually incorrect
2) According to you, since the US has absolute advantage in ag and mining, we should specialize in that (“my advice is that the USA, to the extent it specializes at all, it should be whatever the USA’s absolute advantage is.”). It is interesting to see you back away from that claim now.
Warren Platts
Dec 19 2019 at 12:34am
As I said above, Jon, USA does not really have an absolute advantage in ag and mining. Consider that Brazil produces more soybeans that USA. China produces more pork than USA. It is true that USA produces 17 million barrels a day of oil, making them the largest oil producer in the world; but on the other hand, we consume 20 million bbl of oil a day. Thus although we produce more oil than S.A., and that might lead one to conclude USA has an absolute advantage in oil, but S.A. would nonetheless have a comparative advantage over the USA. After all, we still import oil from them, not vice versa. And in any case–again–both Ag & Mining only comprise 2.4% of total GDP. We’d have to export every last grain of corn, and every last drop of oil just to close the trade deficit. The idea that USA ought to specialize in Ag & Mining is laughable.
As for my personal. opinion, I will state it again: as a “Trumpian protectionist” I don’t think a continental-sized economy like the USA ought to specialize in anything. Period. That is a free trader idea. And I stand by my earlier claim that if you want to stump a free trader, just ask him what exactly the USA ought to be specializing in.
As for mercantilist industrial policy: yes, that should be focused the “Professional, scientific, and technical services” BEA line item because that, if anything, is the one unique advantage we have over the ROW, plus the positive externalities that generates, especially for manufacturing.
Jon Murphy
Dec 19 2019 at 8:38am
Right, but that is factually incorrect given how you define absolute advantage.
And yet that is precisely what you advocated: “the USA, to the extent it specializes at all, it should be whatever the USA’s absolute advantage is.”
So now that you claim the US should not specialize in its absolute advantage, you need to adjust your normative claim.
Now, your explanation about “Trumpist mercantilism” has two problems:
First: it contradicts other claims you and Trump have made where the US should precisely specialize in a few things (industrial planning. Indeed, you have said in the past it is the only way we can defeat the Chinese, so you need to square that circle).
Second: the whole concept of a “continent-sized economy specializing in one thing” again is an incorrect understanding of economic theory. You will find nowhere in economic theory any evidence to support your claim. You say “if you want to stump a free trader, just ask him what exactly the USA ought to be specializing in.” A response has been given multiple times, a response which you never successfully refute. Rather, I say “if you want to stump a mercantilist, especially a Trumpian mercantilist, just ask him a question about basic economic theory.”
Jon Murphy
Dec 17 2019 at 7:12pm
Agreed. Again, which is why Smith, Hume, Ricardo, etc opposed “national specialization” plans like the Corn Laws and other mercantilist schemes.
But the larger point is that comparative advantage does not predict national specialization. That is merely a pedagogical tool we use to teach undergrads to think about trade patterns. You are taking the model way too literally, and this treating it incorrectly. It’s like using a hammer to fix a live electrical wire and then declaring the hammer is faulty because you keep getting shocked.
There is no such thing as “national specialization.” Since nations do not choose, only individuals, nations do not face costs. Therefore, nations cannot specialize since they do not have costs, QED. Do not make the mistake of taking models too literally.
NB That is not free trade. That is industrial planning.
Furthermore, you seem to be laboring under the false idea that specialization means complete specialization. Again, even in the context of the model, this is not necessarily the case. The degree to which specialization occurs will depend on the opportunity cost. Nothing about the model predicts complete and total specialization. For example, see Krugman et al 2018, Boudreaux 2007, Openstax, Kahn Academy, Cowen and Tabbarok (2007).
Pete Smoot
Dec 18 2019 at 11:51am
With all due respect, I think you totally misunderstand the example. Ricardo is not saying that England must only produce cloth. He’s saying that if an Englishman wants to maximize his value produced, he is better off producing cloth. In general.
That’s emphatically not to say that all Englishmen should be forbidden from growing wine. That’s more of a protectionist than free trader position. If a specific Englishman wants to grow wine, because he’s got an especially good vineyard, or he emigrated from Portugal, or he has a large fortune and wants to make a small fortune, Ricardo and free traders are perfectly happy to let him.
I’m really mystified by this question. Of course it would stump a free trader because they’d realize the question is unanswerable.
Economies don’t specialize, people do. Even that is too strong a statement. People tend to specialize. For example, I write software for a living but I also drive myself around, cook meals, and work on home improvement projects, all things I could hire out if I wanted to spend more time programming for money. It’s not black and white.
The US economy as a whole does not specialize. We don’t only produce cars, or software, or cloth, or wine. (What would “we produce cars” even mean? That we pour iron ore in one end of a building and cars come out the other?) We produce lots of different things. So do the collective efforts of people in other countries. No free trader would say “the US should only produce these things and never produce these other things.” A protectionist might but not a free trader.
Warren Platts
Dec 19 2019 at 1:52pm
Hi Pete, thanks for the comments, but they are basically straw men.
Regarding Ricardo, I agree that it is not the case that people are “forbidden” to make wine. The picture he presents, rather, is of English vineyards literally withering on the vine because they cannot compete with cheaper Portuguese wine. Thus the former wine growers are “forced” into weaving, but only in the sense that there are no more wine growing jobs, and there are lots of new jobs producing cloth for export; no doubt Mr. Murphy will say they “choose” their new jobs because they could choose to starve to starve to death instead. Whatever. It doesn’t matter how you want to describe it: in Ricardo’s model, the former wine-growers get new jobs making cloth. Whether they are “forced” by circumstance, or they “choose” not to starve, the end result is the same: England winds up specializing in cloth.
Moreover, for the purposes of Ricardo’s model, there is no requirement that 100% of all wine production ceases. It might be the case that the English wine growers only lose half their former market share. Ricardo’s argument still holds.
As for stumping economists by asking what the USA ought to be specializing in, there is no requirement that that the USA must specialize in one single thing. In Ricardo’s model, England ends up specializing in one thing, but that is only because there were only two things to being with. It is possible for the USA to specialize in any number of things. After all, what does specialization mean: it simply means that the country produces less importables and more exportables.
Again, there is no requirement that 100% of the importables be given up. If there is a single factory making gloves and a single factory making silverware, those are merely the exceptions that prove the rule that USA has given up on making gloves and silverware. The argument still stands.
As for the answer to my question, it actually should be very easy for a free trader to answer. Since whatever the free market does is for the best, then they SHOULD say that USA ought to specialize in whatever it is the USA happens to be specializing in.
But this is where it gets problematic: it is problematic because if you look at what the USA happens to be specializing in, it things like soybeans, jet airplanes, and the selling off of that which are grandparents produced and that which our grandchildren WILL produce.
Do you see the problem? Selling off our patrimony and mortgaging our posterity seems a hell of thing to want to specialize in, soybeans and other raw materials are normally what we expect 3rd world countries to be specializing in, and while jet airplanes are nice high-value items that a 1st-world economy ought to export, there is seemingly nothing to prevent its eventual offshoring just like practically every other American invention!
Thus, to be fair, I probably shouldn’t say the free trader economists are stumped by my question; rather, they are smart enough to know that their answer is not going to play well with the Joe Six Pack voters on the Main Street in Lordstown. Why, the electorate might even lose confidence in their “expertise!”
Wait…
Pierre Lemieux
Dec 14 2019 at 1:43pm
Another point: if Trump’s tariffs are seemingly “working as predicted” for US growth, why is he begging the Chinese government to allow him to reduce them?
Warren Platts
Dec 16 2019 at 11:52pm
Trump is not begging the Chinese for anything. He’s just disingenuously giving them enough rope to hang themselves. Once they break their end of the deal, as they always do, Trump will be able to jack the tariffs even higher, and then blame it on the Chinese.
Jon Murphy
Dec 14 2019 at 3:13pm
This isn’t quite as strong a condemnation of comparative advantage as you think; it’s actually a condemnation of industrial planning.
It is true and correct to say that each individual has a comparative advantage; mine is in teaching and researching economics, others are in cooking, still others in auto manufacturing, etc. The fact that many people have differing comparative advantages is precisely why “forcing” (to use your term) people into some national plan must result in allocative efficiency losses. So, programs like tariffs or industrial planning that are explicitly designed to move (force) people from their comparative advantage toward some perceived “national” comparative advantage necessary result in allocative efficiency losses. That is exactly why Ricardo and Smith and Bastiat and Krugman and so many other economists predict interference in free trade lead to poverty, not wealth.
Indeed, I am glad you remembered that individuals, not countries, have comparative advantage, that the Ricardian model is just that: a model. It seems reading Boudreaux and Lemieux has done you some good.
Now, let us discuss where you are incorrect:
This is incorrect. Note you have subtly abandoned comparative advantage to make your point. No one is “forced” to move from one industry to another by changes in free trade. Rather, they do choose to move. And, if they choose to move, it is because their comparative advantage has changed! A comparative advantage is not an objective thing; it is subjective to the relevant comparison. Compared to my students, I have the comparative advantage in economics. But compared to my dissertation committee, they have the comparative advantage. My shift from teacher at one school to student at the other does not mean there are allocative efficiency losses: indeed, precisely the opposite! There are gains!
What is causing your mistake is you do not realize that relative prices, and thus opportunity costs, have changed. When opportunity costs change, so thus does the allocative efficient point. Indeed, to remain in the same profession even after opportunity costs have changed leads to efficiency losses.
Remember back to your days studying economics at the University of Chicago: the allocatively efficient point is where the price ratio is tangent to the PPF, intersecting at the highest possible indifference curve. If the price ratio changes for whatever reason, then there is a new tangent point and some people’s comparative advantages have subsequently changed and they move from one industry to another (see pages 106-109 of Chicago Price Theory by Jaffe, Minton, Mulligan, and Murphy). Thus, an effort to preserve the allocation of labor at the previously allocatively-efficient point even though the allocatively-efficient point has changed will itself be inefficient! QED.
Now, you might object and say “well, the whole point of tariffs is to return the price ratio back to that previous point.” Fine, but two important points:
First: Prima facie, there’s nothing to say the original allocation is superior to the new allocation. One may argue for political, social, or other “non-economic” reasons, and that’s fine, but then the introduction of such quasi-rents eliminates monetary prices’ usefulness as a measure of efficiency, so one cannot even set the tariff properly nor predict the new outcome is more “efficient.”
Second: Monetary price is not the only price individuals face. The total price (which is encapsulated in the price ratio) includes monetary outlays put also includes all other costs as well. Only under very precise conditions is the monetary price a reliable proxy for total costs.
One final point:
No, for the reasons I lay out to Pierre below. CF Krugman, Obtsfeld, and Melitz 2018, Stolper & Samuelson 1941, and Krugman 1993 for starters.
The long and short of this whole comment is this: your claims about “standard trade theory” do not hold up when scrutinized by standard trade theory.
Warren Platts
Dec 17 2019 at 1:45am
Jon, you are equivocating on two senses of the word ‘force’. I am using the word in its generic sense of simply meaning there is little to no choice involved. There is no need to invoke active coercion at the point of a gun. If you are a furniture maker, and every furniture company in the country either goes bankrupt or offshores its production, you are forced out of the furniture-making craft and into another line of work (or drop out of the work force altogether). You do not “choose” to quit making furniture.
So then what happens? People sloppily sling around the descriptor ‘comparative advantage’. Myself included: I should have said these furniture makers have an absolute advantage at making furniture. It is what they are best at, and hardly anyone else can do a better job, that includes showing up on time at 6AM day after day, year after year, not getting popped on drug tests, learning all the tricks in the craft, and taking pride in building quality furniture.
So when all the furniture making jobs go away, even though they lost the one job where they had an absolute advantage, you are right: no matter what, they will still have a comparative advantage in something! The question is whether they–and the nation–will be better off as a result.
And this is where you go off the rails: your Panglossian paradigm is forcing you to perceive a mistake where there is none. I get it that opportunity costs and hence comparative advantages shift over time. My point is that such shifts are not always for the best, whereas you (and 99% of all other American economists) practically define ‘that which is for the best’ as meaning the same as ‘the outcome of free market forces’.
And to show why that is wrong, it is not necessary to bring in “non-economic reasons” like national security, community values, or duties to stake-holders and fellow citizens. I am content to define efficiency as average labor productivity–dollars worth of output per person per year.
So what happens? Well, ideally, according to the beautiful theory, trade will be balanced, and the former furniture maker will get a job in the national specialty export industry producing more output per year than he/she did at the furniture factory. But of course in real life, in the United States, in the 21st century, that never happens. Instead, since they lost the one job where they had an absolute advantage, they are forced into jobs that they are less good at, most likely in the service sector. And in rough, round figures, service sector jobs output per person per year are on the order of $50K compared to on the order of $200K for manufacturing jobs.
I call that an efficiency loss: a guy putting out $200K of GDP/year then forced into a job putting out $50K of GDP/year certainly cannot be called a “gain” unless “gain” is defined as “outcome of market forces”. And of course we are not even talking about market forces. We are talking about consequences of decisions made by foreign Communist bureaucrats.
As for your QED “proof”, that does not apply. As you like to say, models can be useful, but one must understand their limitations, and not try to apply them where they do not apply. The USA is not at the PPF. We are under the PPF. Yes, 3.5% unemployment looks good, but last I checked the U6 rate was something like 7%, not to mention the labor force participation rate is down from pre-GR levels. There is still a lot of slack in the labor market.
Bottom line: prima facie, when you reduce the diversity of jobs in an economy in such a manner that necessarily converts manufacturing workers into service workers you introduce efficiency losses into the economy.
Jon Murphy
Dec 17 2019 at 8:59am
Ok, but that doesn’t apply here.
Except you do. Resources are scarce, which means there is always a choice to be made. There is an explicit choice being made: continue to operate and try to find some way to be competitive or shut down. As evidenced by the fact some folks still manufacture furniture in the US, and do so at an economic profit, is proof point of my point there is a choice.
Indeed, the entire purpose of competition in standard economic theory is to minimize costs of production and to have firms that are unable to produce most efficiently choose to deploy their resources elsewhere where they will be more efficient. Remember: just because one may not personally like the choice he is making, that does not imply either there is “little to no choice” nor that the choice is undesirable compared to relevant alternatives.
And the answer, according to standard economic theory, is yes. True, for the individual, it may not be best initially, but it certainly is over time. That is what standard economic theory predicts.
That’s incorrect. “Best” is a normative term. I am reacting to your discussion of “efficiency,” not “best.” That is why the word “best” only appears in your response to me, not in my initial response to you nor your original post. Please stay on topic.
That’s fine, but notice now you are abandoning standard economic theory with this incorrect definition of efficiency. In which case, your analysis breaks down. You can’t change the theory halfway through and then claim the theory is inconsistent.
Problem: you claimed once that scarcity only exists at full employment. If the US is not at full employment, then, there is no such thing as scarcity. If there is no such thing as scarcity, then there is no economic problem. Therefore, economic theory does not apply, so your entire above argument is irrelevant. Without scarcity, there are no costs, there is no competition, people can have any job they want, no one is being “forced” (using your usage of the term) out of anything.
Warren Platts
Dec 17 2019 at 2:22pm
Jon, your comment, besides being all over the map, is mere pedantry that does not at all touch my main point that I made in my original post responding to Pierre’s essay: that increasing international division of labor through national specialization must necessarily reduce intra-national division of labor and hence reduce the diversity of opportunities for individual specialization and that for the country suffering the loss of diversity, we can expect efficiency losses. Conversely, to the extent that tariffs reduce international specialization while increasing home opportunities for specialization, we should expect the home economy to be more efficient even as international deadweight losses are increased.
Why? Because the more diverse an economy is, the more likely it is that individuals will be able to find a niche in which they have an absolute advantage. In a monoculture economy, in contrast, the vast majority of workers will be forced into jobs where they only have a comparative advantage. Consequently, such workers will not be working at their full potential, and therefore, the national economy will not be as efficient as it could otherwise be, even as global deadweight losses are eliminated.
Jon Murphy
Dec 17 2019 at 7:51pm
I did address that, I showed, based on simple, correctly-applied theory and basic definitions, your conclusion is incorrect. You then wanted to change the topic, which is fine, to which I responded to the new points you were making. You wanted to change the conversation to talking about average productivity of labor rather than opportunity cost.
So, I am merely responding to you. If it is “all over the map,” it is merely in response to your comments.
Now, for some reason, you keep bringing up this “national versus personal” division of labor. However, all of us have shown you that’s not a real thing. There is no “national comparative advantage.” That is merely a heuristic. Seeing as you keep bringing up something that does not exist, it is no wonder why you see a contradiction where there is not one.
Warren Platts
Dec 18 2019 at 1:03pm
And this is a cop out. Appealing to half-baked metaphysics does not help your case. This is not the place to debate the ontology of spatio-temporal aggregations; I will merely point out that you are wrong. And consider this, if nation-states are not real with their own emergent properties that can be studied, then neither are economies. Basically, you imply that your own field is the study of spooky phantoms and ghosts.
Jon Murphy
Dec 18 2019 at 2:26pm
Standard economic theory is not a cop-out or half-baked metaphysics. I highly recommend you review your Samuelson if you don’t believe me. Stolper-Samuelson is a good starting point.
Jon Murphy
Dec 18 2019 at 10:11pm
What did I say that made you reach this conclusion? Nothing could be further from the truth! Economics is all about emergent phenomena! All my posts are about emergent properties!
The key word here is “emergent.” Emergent means “arising as an effect of complex causes and not analyzable simply as the sum of their effects.” The emergent phenomena of the market process is due to the complex actions of millions and billions of individuals making trillions of decisions. It is not about the “nation choosing” to do X, Y or Z.
People choose. Thus, only people face costs. Since comparative advantage is about comparing opportunity costs, it doesn’t make sense to talk about “national comparative advantage” as you do. Nations do not face costs since they do not choose.
What you are missing is this: the emergent properties of a given collective are distinct from the collective itself. To go back to your ecology example, there are emergent properties of, say, a jungle: it is hot, humid, has certain kinds of life, etc. Now tell me, does it make sense to say “the jungle chooses to be humid?” As a literal sentence, it makes no sense, and yet if we were to take your understanding of emergent properties here, you must conclude that the jungle is an acting agent. You would reach the same absurdity that you do with “national comparative advantage” (indeed, one could claim that an ecosystem so specialized as the jungle is inherently bad, or “inefficient” in your jargon, for the creatures living in the jungle. The logic is identical to what you applied above).
You must remember to keep emergent phenomena separate from the actual actor involved. That is the big mistake you are making: you confuse who the actor is.
Warren Platts
Dec 19 2019 at 12:53pm
So you really want to get into this Jon? OK fine. First of all, your theory of “an acting agent” is literally medieval. Your argument seems to be that agency requres a soul, and since only humans have souls, then something like a nation-state apparently does not have interests and cannot “choose”. The problem is that concept of a soul is scientifically useless.
So lets start from scratch. Unless you are something like a quark or a photon, you are an aggretation–a spatio-temporal group with a more or less definite physical location, and a beginning, a middle, and an ending. The human brain is composed of many suborgans that are in turn composed of neurons and various neurochemicals. Your ability to “choose” is an emergent epiphenomenon of the parts of your brain. Thus, when you get into the nuts and bolts, the very idea of freedom of choice becomes highly problematic. If we had complete knowledge of every molecule in a brain, we could predict ahead of time every choice that brain would make.
Nonetheless, scientists still find speaking of “choices” to be pragmatically useful. Therefore, such “choices” are “real” to the extent they allow scientists and others to make accurate predictions. Posited “souls”, on the other hand, are useless for making predictions. Therefore, “souls” are not “real”–at least from a scientific perspective.
And if souls are not necessary for “choices” and all that is necessary for a choice to be real is that it makes scientific predictions possible, then there is nothing wrong with saying that an autonomous vehicle makes choices to avoid obstacles or that a nation-state makes a choices such as a choice to go to war.
Thus to the extent that scientists (to the extent that economists are actual scientists rather than propaganda wonks) find it pragmatically useful to speak of “national comparative advantage” or “national specialization” because those concepts allows accurate predictions of empirical patterns, then then there is such a thing as a national comparative advantage or national specialization. Google those things in scholar.google.com and you will get thousands if not millions of hits. Google “there is no such thing as national specialization”, and you will get a single hit: to Jon Murphy.
Thus your latest idea is apparently entirely original to you, Jon. Good luck with that sir!
Jon Murphy
Dec 19 2019 at 3:13pm
No. Agency requires no “soul.” No idea what I said that got you there. I was quite specific: agency is a verb, thus you must be able to identify who is acting. Who is making the choice? That is the question you must answer. Show me the choosing action. Mere appeal to some low metaphysical idea about the nature of souls or free will, as you do, is insufficient.
As an aside to the reader, this is why I think learning Macro before Micro is largely a mistake. Without understanding the relationship of the individual to the emergent order, in other words, to treat the emergent order as entirely separate from the components that make it up, is incorrect.
Jon Murphy
Dec 14 2019 at 12:13pm
Pierre-
I think there’s an error in your post.
You write:
I agree with everything up to your last sentence. I do not agree that the theory implies less free trade implies more employment but less consumption. As I understand comparative advantage, the theory implies more employment in the previously imported sector but at the expense of the other sectors. Total number of jobs stays the same, but the type of jobs change.
As I understand your comment, you are making a ceteris paribus assumption where the same amount of goods (represented by GDP) are consumed. If we are importing 500 pieces of furniture from China and that trade is cut off, then domestically 500 pieces of furniture will need to be made in order to maintain the same standard of living. (My objection stems from my understanding here, so if I am incorrect everything I am about to say will be invalidated.)
But one of the key insights of the comparative advantage model is that specialization and trade allows one to consume beyond the PPF. We can consume at a point unobtainable in autarky. In other words, one cannot maintain the same standard of living in autarky as with trade. Thus, if we were to restrict trade, sure 500 pieces of furniture could be produced domestically, but at the cost of X number of units of some other good, as we return to the PPF boundary. So, more workers shift into furniture but out of some other production. Total employment stays the same. The types of jobs change.
So, my objection to your last sentence is that in theory total employment would not increase employment and decrease consumption. It would just decrease consumption.
Pierre Lemieux
Dec 14 2019 at 12:40pm
Jon: That’s a valid point, which I concede. You are right (in the general case).
Indeed, I have made a related point in Fig. 5.2 of my recent book What’s Wrong With Protectionism? Total employment is independent of trade and is a direct function of population. I have recently updated my figure (now 1960 to 2018, each year represented by a point on the chart):
What I did in my post was to consider a special case and make an implicit assumption, which I should have made explicit. I assumed, in a Trumpian way as it were, that the economy started at less than full employment, a not-totally-free market at home, and partial free international trade. Then, if the economy moves to less free international trade and (Trumpian illusion) a freer domestic free market, it is pretty obvious that employment will increase. (Whether, in these special circumstances, consumption will increase or decrease depends on the comparative effects of more economic freedom at home and less economic freedom towards foreigners. I assumed it would decrease, which was an unwarranted assumption.)
Warren Platts
Dec 17 2019 at 1:30pm
Agree that when employment is less than full (especially when there is a huge, chronic trade deficit), tariffs should tend to increase overall employment. And since most of the new jobs created are being filled by what Marx called that vast army of the unemployed, it will tend to be an unalloyed plus at least for home workers, if not investors in multi-nationals with a heavy exposure to the Chinese economy.
That tariffs versus free trade should not have an effect on overall employment is a stylized fact mentioned in Krugman’s “Ricardo’s Difficult Idea” paper. But again, for that to be the case, employment must be full to the brim, so that that filling a new job opening necessarily requires that someone quit another job that then goes unfilled.
So lets just go with that for a moment. Should we expect tariffs in that case to necessarily have a negative effect on the economy? It depends: if the jobs being filled in the protected industry are coming from jobs with a higher labor productivity than the jobs in the protected industry, then yes, that would be bad because consumption would decrease.
But a priori, why should we expect, as Jon apparently does above: that the jobs in the industry protected by new tariffs would in fact be filled by workers in more productive industries, and would thus “just decrease consumption”?
Answer: we should not expect that. We should expect the opposite, that the workers flowing into the newly protected industry will come from less productive sectors, most likely the service sector. Thus, rather than seeing oil field workers who produce $2 million worth of GDP per year flowing into manufacturing jobs that produce $200K worth of GDP, we would be much more likely to see food service workers who are only producing $30K worth of GDP per year flowing into the protected manufacturing sector.
Why? Because big oil companies can afford to outbid manufacturing concerns for their best workers, whereas mom ‘n’ pop restaurants and fast food joints cannot.
Jon Murphy
Dec 17 2019 at 7:53pm
No. It goes back to Ricardo and Samuelson. It’s also empirically proven (see Krugman et al 2018).
Warren Platts
Dec 18 2019 at 1:42pm
What I wrote does not imply that the idea that trade versus tariffs does not change employment when employment is full is original with Krugman. That said, both Ricardo and (Stolper &) Samuelson’s models ASSUME full employment. As for Krugman’s textbook, you’ll have quote chapter and verse on that; in my edition there is no “empirical proof” that trade versus tariffs does not affect overall employment.
What Pierre described is a 21st-century economy in the United States:
That is actually the standard view under such circumstances. As Samuelson (1964) wrote in one of his classic papers:
We are way overdue for another recession. To the extent that Trump has managed to pull off an economic miracle, it is that he has kept us out of a recession so far. Given USA’s peculiar position in history right now (somewhat less than full employment, relatively slow growth, and huge trade deficits) judicious application of tariffs can only help.
Jon Murphy
Dec 18 2019 at 5:01pm
Acutally, yes it does. If you did not mean to imply that, I suggest you word your sentences better.
Ricardo does not explicitly given the idea of full employment comes after him, but that’s neither here nor there. Your comments here implicitly assume full employment, too.
Pg. 21 (Chapter 2) and Chapter 8. See also Krugman and Lawrence 1994.
So, are we in a recession or not? If we are not, then we are at full employment (by definition). If we are not at full employment, we are in a recession.
Also, point of fact, you ellipse out key points of Pierre’s quote.
Warren Platts
Dec 19 2019 at 2:14pm
Jon, you are shooting from the hip again.
Re: Krugman, I said he “mentioned” the stylized fact that trade does not affect overall employment, which is true. If you think that implies he was the 1st guy to think full employment, that is your projection.
Re: Ricardo, he probably doesn’t employ the phrase “full employment”; nonetheless, the total number of workers stays the same before and after trade. Every new worker in weaving requires one less worker in the wine sector. I call that full employment. And anyways, you are the one who brought up Ricardo in this regard.
Re: Krugman’s textbook, I have already looked in Chapters 2 and 8. There is no “empirical proof” mentioned in there that says that trade never has an effect on overall employment levels. But I have the 2009 edition. Maybe in the latest edition there is such a proof. So if you could provide the exact quotation, that would be helpful.
Re: Recessions. FYI a recession–by definition!–is when there are two quarters in a row of negative growth. Full employment has nothing to do with it, other than that recessions sometimes start when there is full employment, and always end when there is way less than full employment.
Re: Pierre’s quote, I put in the ellipsis because the cut out parts were superfluous to the topic at hand: whether, when employment is less than full, tariffs will increase overall employment. If you disagree with Pierre (and Samuelson) in that regard, that’s cool, but don’t blame me! I was merely reporting what they said.
Jon Murphy
Dec 19 2019 at 3:20pm
Ok. That’s not full employment, though. That can occur in a recession or beyond full employment.
The citation I give is consistent from the first edition of the book. So no, this isn’t newly added.
Quid pro quo: you give me the exact quotation to support your various claims you’ve made, every single one of them from “national comparative advantage” to this most recent one, and I will quote for you. But until you show me the same rigor I have provided for you, rather than just merely asserting your points, I shall do no more.
Correct, which is also a retreat from full employment (see any intro macro textbook, for example, OpenStax, chapter 11).
You probably thought they were, but as I said, they were important. You would do well to go back and re-read the quote in full.
Jon Murphy
Dec 19 2019 at 3:24pm
Look, Warren, despite my expertise, my cited sources, the expertise of the other commentators here, and the logic and mathematics of the models, I will not convince you. Thus, I will not post anymore and you may have the last word.
Pierre Lemieux
Dec 24 2019 at 11:54pm
Warren: There is no such definition, although some statistical agencies, but not in the US, use this as a rule of thumb. In way analogous way, defining real GDP per capita as a Fisher index of certain money values would be confusing the measure with the measured phenomenon. Idem for defining inflation by an increase of the CPI (for example, what do you do if the CPI increases but not the PCE index does not?).
Comments are closed.